Analytics
On the menu in the top left of the page, click Analytics. This will take you to the page where you can view various analytics on your tests, plans and configuration. There are 4 tabs, each showing a different perspective of your data. We've launched our analytics initially as beta, we want to get some real-world data in the system and see how users are using the platform before we develop this further. We want to validate our assumptions, as well as make tweaks and improvements to bring you as much value as we can.
TIP
Remember, if you have changed the names of your Tests or PoV Plans, the buttons and descriptions shown may differ from what you see.

PoV Activity
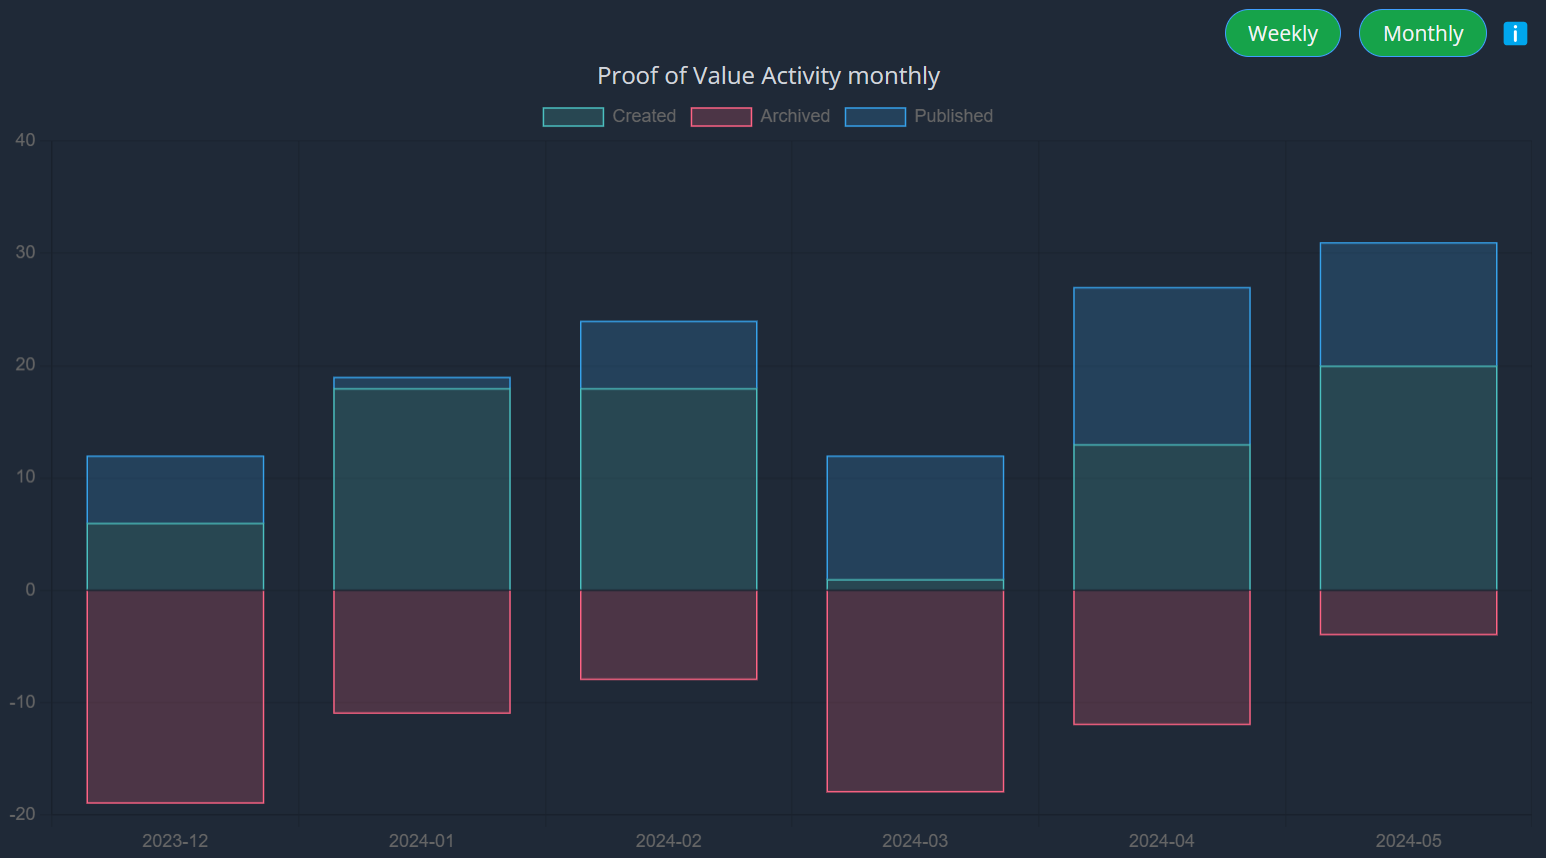
This graph shows how often your Proof of Value are being created, published and archived. The data is broken down by week or month, and the stats are taken when a plan changes its state. This means that a plan created in one month and published in the next, would be counted on different months. Archived plans are counted on the negative side of the axis.

You can switch between "Weekly" and "Monthly" views. Weekly tests are calculated and updated daily. Monthly stats are calculated and updated weekly. Weekly data dates are marked with the date of the week commencing that date. The graph data is cached for you for 24 hours, this speeds up load times, but shouldn't have a noticeable impact on data due to the batch processing nature of it.
Test Usage in PoV Plans
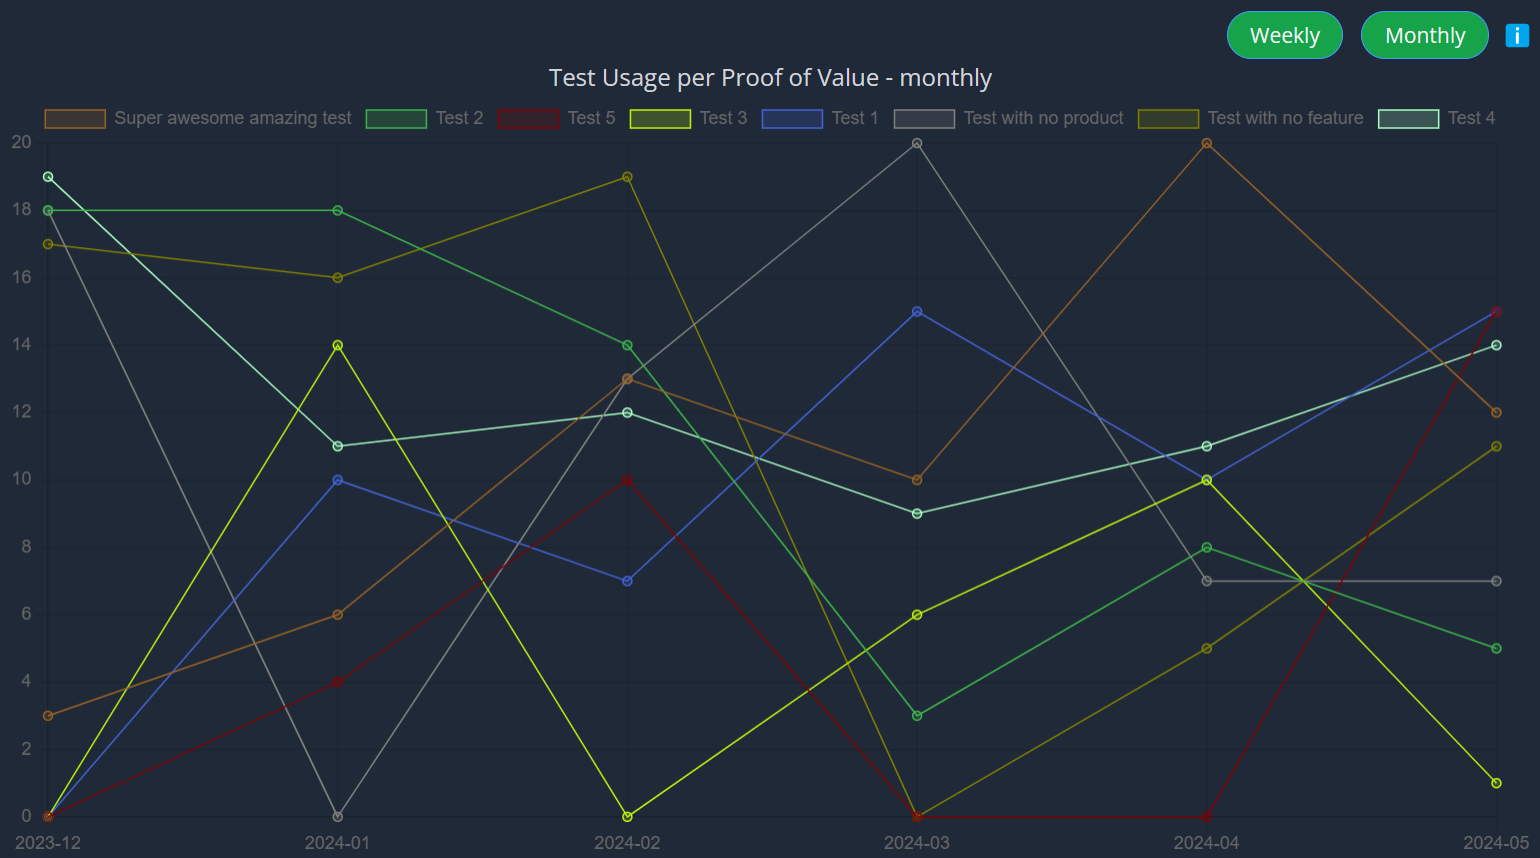
This graph shows how often your Tests are being used in a Proof of Value. The data is broken down by week or month. Stats are taken when a Proof of Value is moved to a "published" state. When a Proof of Value is archived, the Test is no longer marked as in-use. This can give you an idea of which Tests are most popular.

You can switch between "Weekly" and "Monthly" views. Weekly tests are calculated and updated daily. Monthly stats are calculated and updated weekly. Weekly data dates are marked with the date of the week commencing that date. The graph data is cached for you for 24 hours, this speeds up load times, but shouldn't have a noticeable impact on data due to the batch processing nature of it.
Test Usage by Results
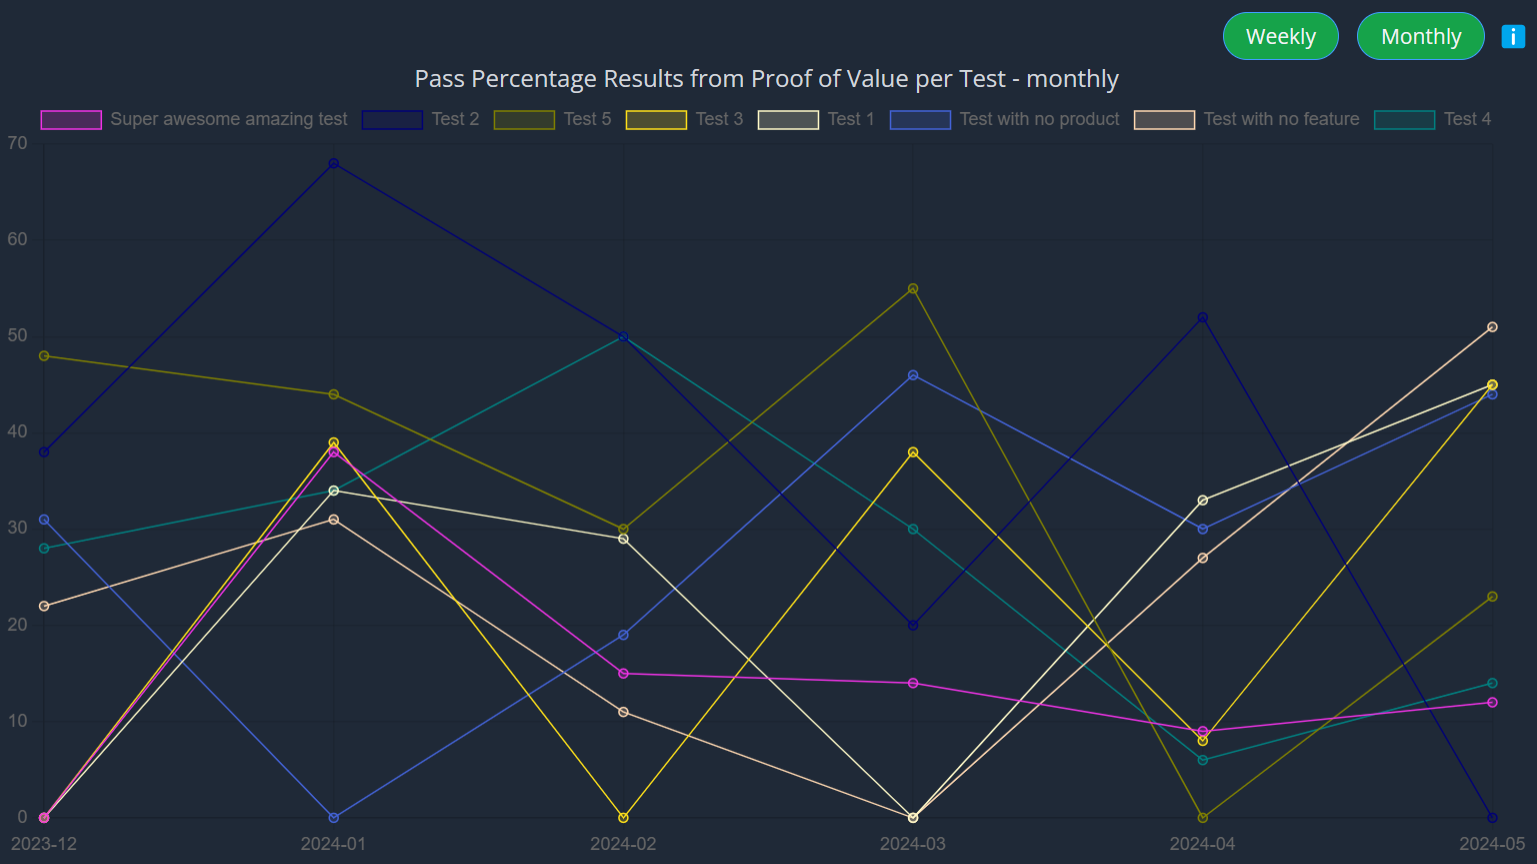
This graph shows how your Tests are performing with your prospects / customers. The stats are taken from published Proof of Value, and recorded when a user marks a Test as passed, failed, or partial. This marks the Test as complete, although if they come back later to update the metrics will also get updated. A "Pass Percentage" is then calculated, based on all the completed metrics, how often is a Test passing. The data is broken down by week or month. This can give you an idea of which Tests are most effective, and which might be causing some problems.

You can switch between "Weekly" and "Monthly" views. Weekly tests are calculated and updated daily. Monthly stats are calculated and updated weekly. Weekly data dates are marked with the date of the week commencing that date. The graph data is cached for you for 24 hours, this speeds up load times, but shouldn't have a noticeable impact on data due to the batch processing nature of it.
Test to Product Mapping
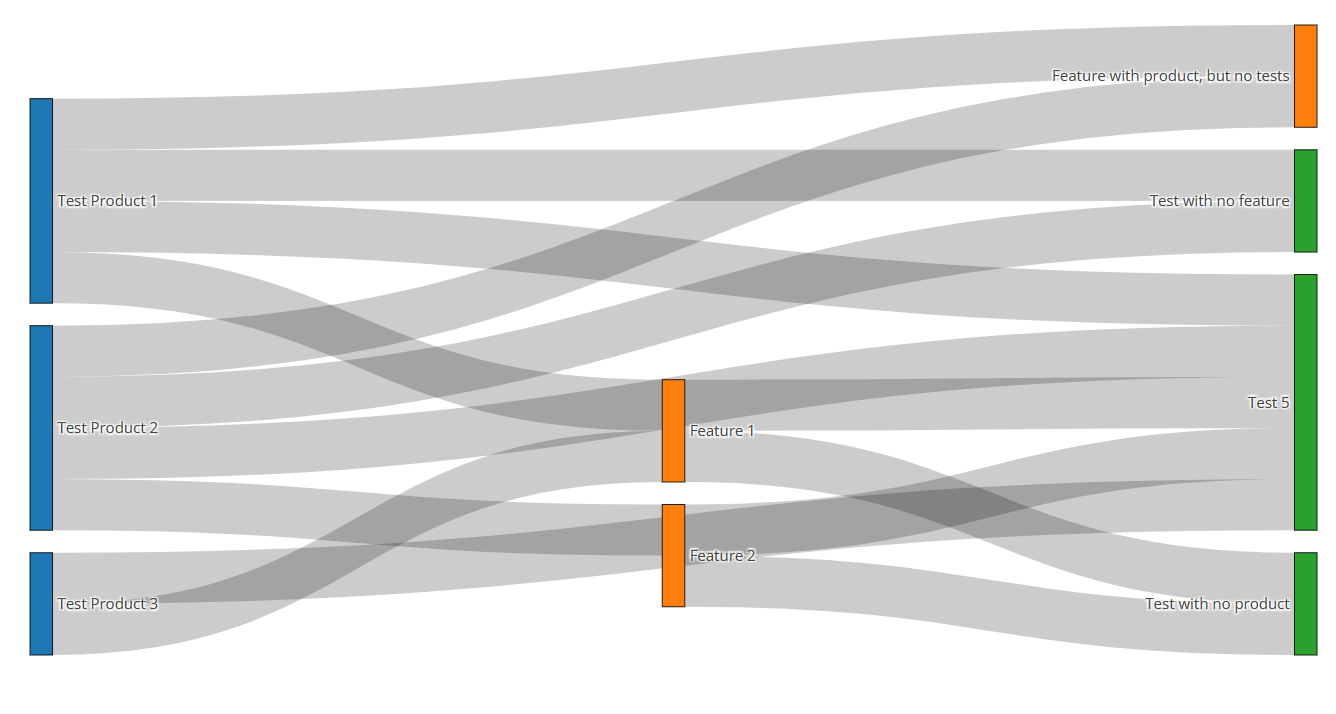
The Sankey diagram here shows the connection between Products, Product Features and Test. This can help you identify where you might have gaps in your Tests, as well as identify if you have any Tests that are not highlighting Products or Product Features effectively.
This is calculated live from the data in your account.

TIP
YIf you go in and modify Tests or General Settings to update Products & Features, it will be represented here immediately. This can be helpful when you're first starting to build our your tests to make sure you have full coverage (or at least coverage of your key products & features / selling points!)